Gallery · SaaS dashboard
A SaaS analytics dashboard, designed by an AI agent
Updated
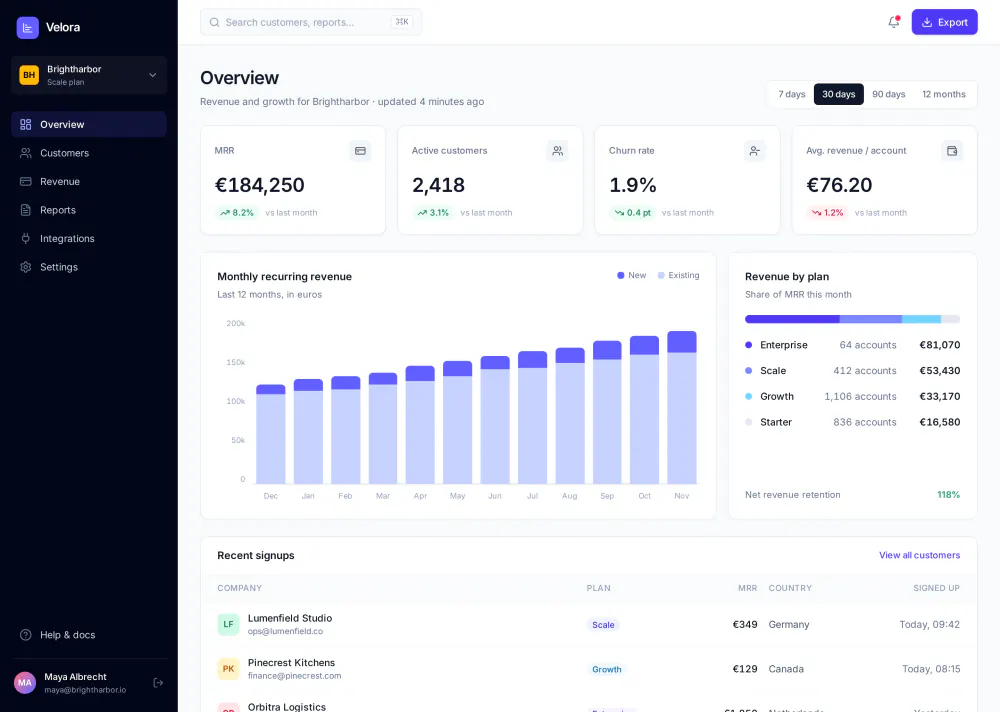
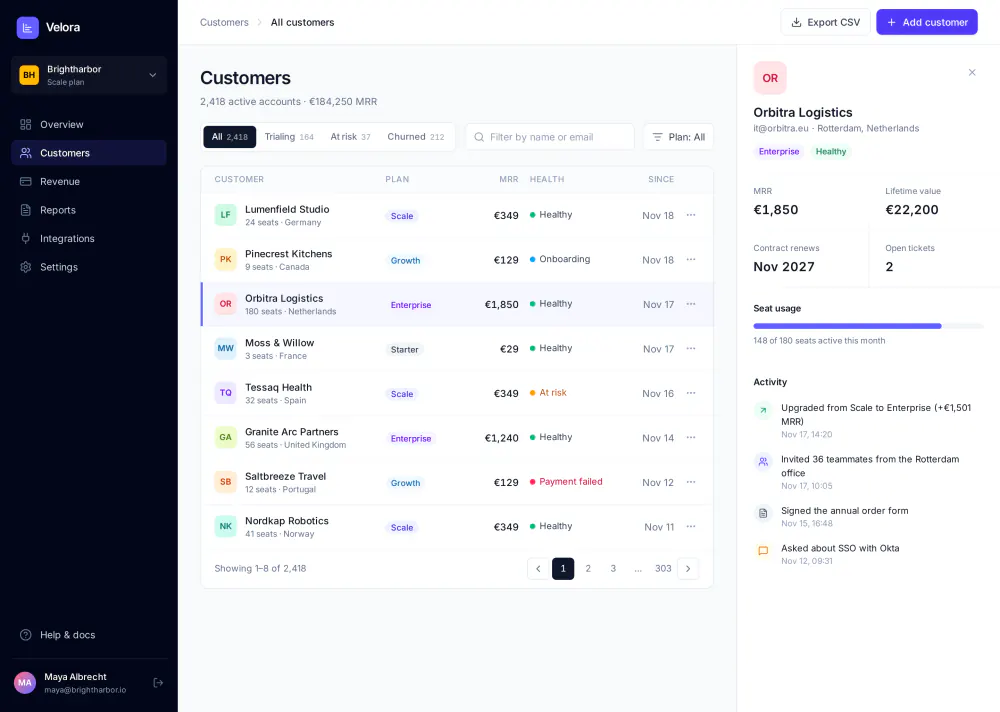
Two desktop screens for Velora, a made-up product that tracks subscription revenue: an overview and a customers screen. Claude Code drew them on a Saymock board from the prompt below, checked its own layout and stopped. What you see is the board as the agent left it.
The prompt
Design a desktop analytics dashboard for Velora, a SaaS that tracks subscription revenue: an overview with KPIs, a 12-month MRR chart, revenue by plan and recent signups, plus a customers screen with a table and a customer detail panel.
Agent: Claude Code, through Saymock’s MCP server. Nobody touched the screens by hand.
The screens
What makes it editable
- HTML + Tailwind, not pixels. Every card, row and label is an element you can select on the board and change by hand, or ask the agent to change.
-
The sidebar is a component with an
activeproperty: both screens use it, so renaming a menu entry changes it everywhere, and each screen highlights its own entry. - Ready for code. Exported to React, Vue or HTML with the same Tailwind classes, the sidebar as one typed component. See design to code.
Make your own
- Connect your agent to Saymock: Claude Code, Cursor, Codex, ChatGPT or any MCP client.
- Paste the prompt above, with your own product, metrics and brand colors.
- Comment on the board, or ask for alternatives: they stay attached to the screen until you pick one.
More boards in the gallery. See also: wireframes first, design review, Saymock for Claude Code.